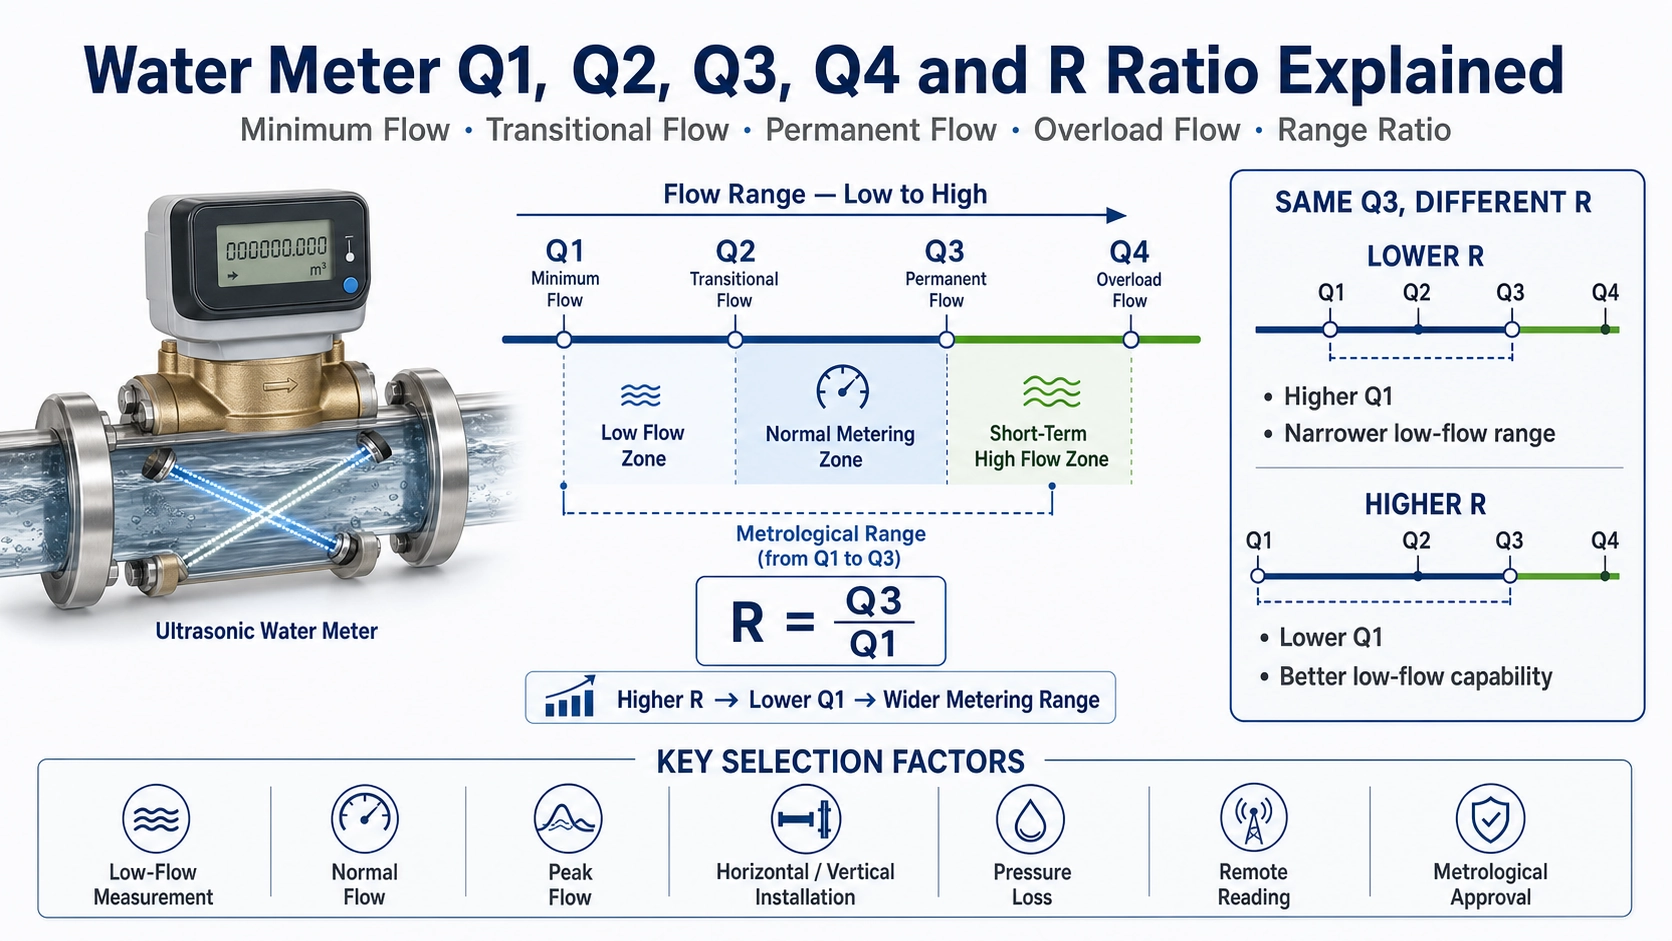
Why Q1, Q2, Q3, Q4, and R matter
Water meter datasheets often list a nominal diameter, a permanent flow rate, an R ratio, and several flow points. These values are not interchangeable. They define the metrological operating range and help buyers compare meters that may have the same DN size but very different low-flow capability.
This article explains the flow-rate terminology used in modern water meter specifications. It applies to ultrasonic and other water meters described under standards based on ISO 4064 or OIML R 49. The exact approved values and permissible errors must always be checked against the meter certificate, local regulation, installation orientation, and temperature class.
The four reference flow rates
| Symbol | Name | Practical meaning |
|---|---|---|
| Q1 | Minimum flow rate | Lowest flow rate at which the meter is required to operate within the specified metrological limits |
| Q2 | Transitional flow rate | Boundary between the lower and upper flow-rate zones |
| Q3 | Permanent flow rate | Highest flow rate at which the meter is intended to operate continuously under rated conditions |
| Q4 | Overload flow rate | Highest flow rate at which the meter must operate for a limited period while maintaining required performance |
Q1 is not simply the smallest number shown on the display, and Q4 is not a recommended continuous operating point. The four values form a defined operating envelope. A meter should normally be sized so that routine demand remains below Q3 while expected low consumption remains above or near the required low-flow range.
How the R ratio is calculated
The R ratio is normally defined as:
R = Q3 / Q1
A larger R value means that Q1 is lower for the same Q3. For example, if two meters both have Q3 = 2.5 m³/h, an R250 version has a lower Q1 than an R160 version. This does not automatically mean that every R250 meter is better in every project. Pressure loss, installation orientation, water quality, communications, battery life, certification, and cost may also affect the decision.
| Example | Q3 | R | Calculated Q1 |
|---|---|---|---|
| Meter A | 2.5 m³/h | 160 | 0.015625 m³/h, or 15.625 L/h |
| Meter B | 2.5 m³/h | 250 | 0.010 m³/h, or 10 L/h |
| Meter C | 4 m³/h | 250 | 0.016 m³/h, or 16 L/h |
The example also shows why R alone is insufficient. Meter C has the same R as Meter B but a higher Q1 because its Q3 is higher.
How Q2 and Q4 relate to Q1 and Q3
Under OIML R 49:2024, commonly used relationships include Q2/Q1 = 1.6 and Q4/Q3 = 1.25. This means the transitional and overload flow rates can often be derived when Q1 and Q3 are known. However, buyers should still use the certified values shown for the actual meter type rather than recalculating a product label from memory.
The lower zone runs from Q1 to below Q2. The upper zone runs from Q2 to Q4. Different maximum permissible errors may apply in these zones. Therefore, a claim that a meter can “detect” flow below Q1 does not prove that the meter measures that flow within the certified error limits.
Starting flow is not the same as Q1
Starting flow, start-up flow, or minimum detectable flow may describe the point at which the meter begins to produce a non-zero indication. This can be useful for leakage monitoring, but it is not the same as Q1.
- Starting flow: the meter begins to respond or register movement.
- Q1: the lowest certified flow point of the defined metrological range.
- Display resolution: the smallest increment shown by the display or transmitted value.
- Leak alarm threshold: a configurable logic value used by the meter or platform.
A product may show a small flow on the display below Q1 without guaranteeing the same accuracy that applies inside the approved operating range. When comparing low-flow performance, request the full specification and the relevant certificate or test data.
Why installation orientation may change the rating
Some meters have different metrological classes or R values for horizontal and vertical installation. The label or certificate may use orientation markings such as H and V. Flow profile, trapped air, bearing loads in mechanical meters, and the acoustic path in electronic meters can all make orientation relevant.
Do not assume that a meter approved as R250 in one orientation retains the same rating in every other position. Confirm the permitted direction, whether vertical flow must be upward, and whether the project approval requires a particular orientation.
How to compare two water meter datasheets
- Confirm that both meters use the same standard edition or a compatible local approval basis.
- Compare Q3, not only DN. Two DN20 meters can have different permanent flow rates.
- Compare Q1 or calculate it from Q3 and R.
- Check Q2 and Q4 where provided.
- Verify horizontal and vertical ratings separately.
- Check temperature class, pressure class, pressure-loss class, and environmental class.
- Confirm whether the values apply to the complete meter and the selected connection configuration.
- Review communication, power, protection, and project-specific functions after the metrological range is acceptable.
Selecting the range for a real application
Residential billing may require good low-flow performance because toilet leakage, dripping fixtures, and intermittent low demand can contribute significant consumption over time. Commercial and industrial systems may place more emphasis on Q3, pressure loss, peak demand, and communication with the control system. District metering may require a wider dynamic range because night flow can be much lower than daytime demand.
Oversizing a meter can push normal demand toward the lower end of the range. Undersizing can create excessive velocity, pressure loss, or frequent operation near Q3 and Q4. Use expected minimum, normal, and peak flow—not pipe diameter alone—to select the meter.
A practical RFQ checklist
- Pipe size and connection
- Minimum, normal, and peak flow
- Required Q3 and R ratio
- Horizontal or vertical installation
- Water temperature and pressure
- Potable, process, reclaimed, or other water quality
- Communication and power requirements
- Local metrology approval
- Remote reading, valve, leakage, or reverse-flow functions
For a broader product comparison, see our DN15 to DN500 ultrasonic water meter selection guide. For field implementation, use the ultrasonic water meter installation and commissioning guide.
The formal definitions and current ratios should be checked in the official OIML R 49-1:2024 recommendation.
FAQ
Does a larger R ratio always mean a more accurate meter?
No. It indicates a wider Q3-to-Q1 range. Accuracy class, approved error limits, installation, repeatability, pressure loss, and long-term stability must also be considered.
Can Q1 be calculated from the label?
Yes, when Q3 and R are stated and the designation follows the relevant standard: Q1 = Q3/R. Use the certified values for final acceptance.
Is a low starting flow enough for billing?
No. Starting flow only indicates that the meter begins to respond. Billing performance must be evaluated within the approved metrological range and applicable legal requirements.