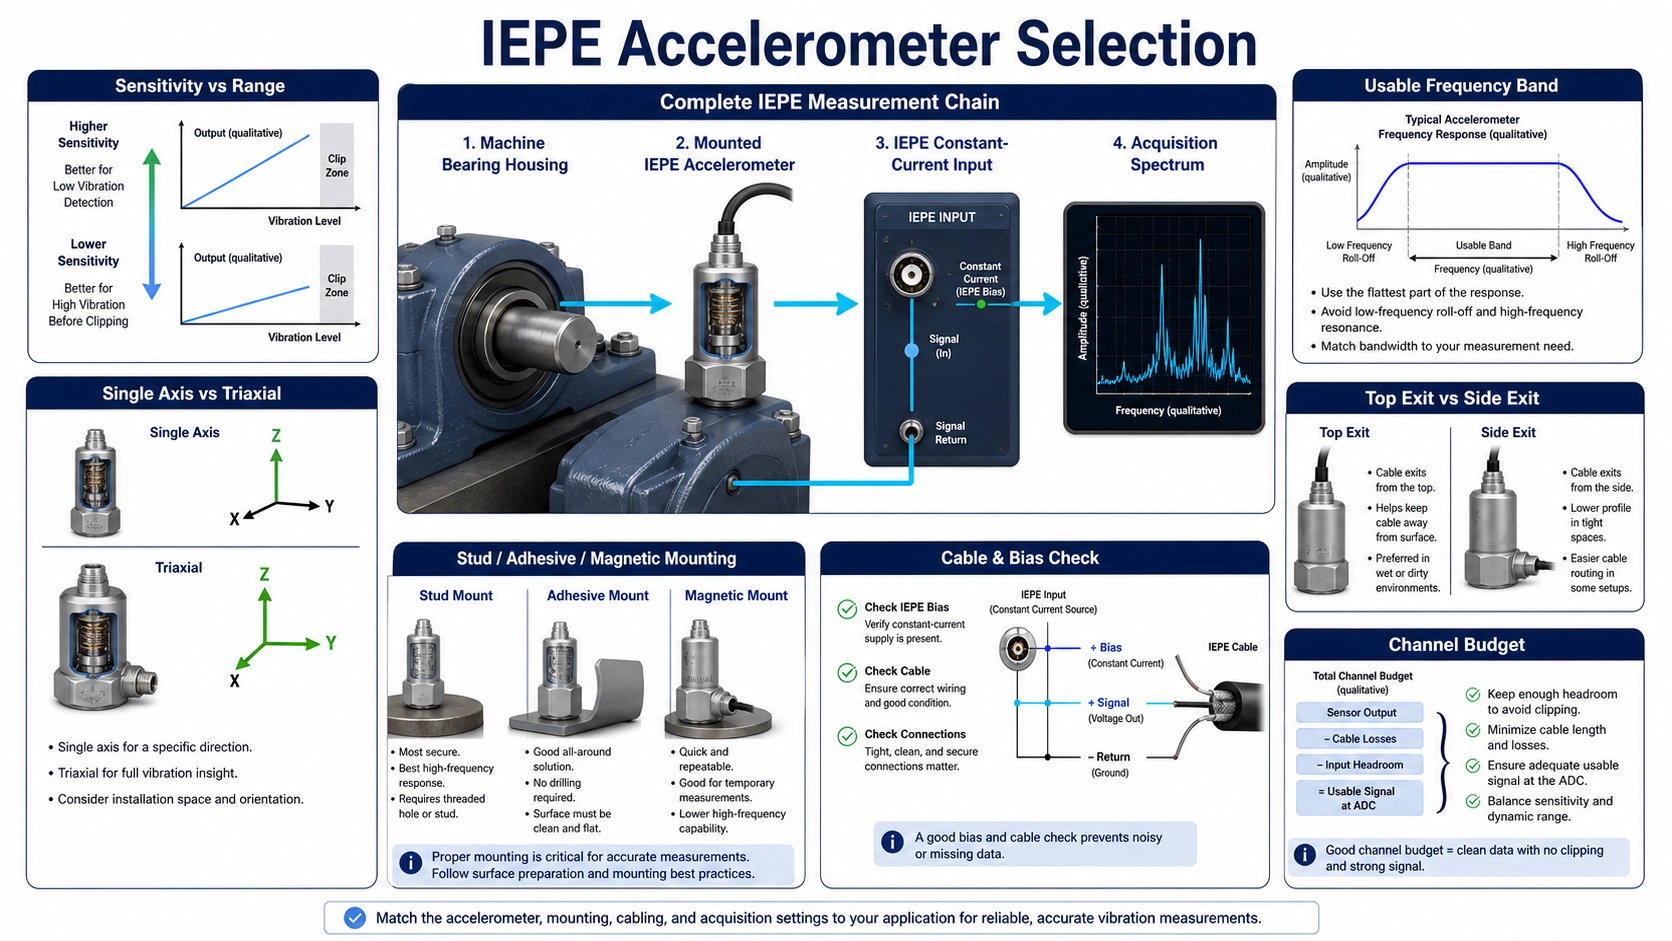
Define the vibration event before choosing sensitivity
An IEPE accelerometer combines a piezoelectric sensing element with integral electronics and normally operates from a compatible constant-current input. It is well suited to dynamic vibration and shock measurements, but it does not measure true static acceleration. Selection begins with the vibration event: expected amplitude, lowest and highest useful frequency, axis directions, machine surface, temperature, cable route and data-acquisition input.
Sensitivity is only one part of this measurement budget. A high-sensitivity sensor produces more output for weak vibration but usually leaves less headroom for large acceleration. A low-sensitivity sensor can accommodate stronger events but places more demand on the noise performance of the cable and acquisition system. The usable combination must avoid overload at the top end and maintain adequate signal-to-noise at the bottom end.
Understand the complete IEPE measurement chain
The mechanical input passes through the mounting interface and sensor base to the piezoelectric element. Integral electronics convert the high-impedance charge signal into a lower-impedance voltage signal carried on the same two-wire connection as the constant-current supply. The acquisition channel removes the DC bias and digitizes the dynamic component.
Compatibility therefore includes more than connector shape. Confirm constant-current level, compliance voltage, bias range, AC coupling, cable capacitance, input range, sampling rate, anti-alias filtering and grounding. A sensor can be mechanically appropriate yet clip because the channel lacks voltage headroom, or appear noisy because the selected range is far above the useful signal.
Sensitivity, range and noise form a three-way trade
Start with a realistic peak acceleration estimate, including transients, not only the normal RMS level. Multiply the expected acceleration by nominal sensitivity to estimate signal amplitude, then leave margin for tolerance, crest factor and unexpected events. At the low end, compare the expected signal with sensor broadband or spectral noise and acquisition noise over the actual analysis band.
The BBVM-AS100 top-exit IEPE accelerometer represents a single-axis industrial configuration. Its suitability depends on verified sensitivity, measuring range, frequency response, mounting, environment and IEPE supply compatibility; the product family name alone does not establish those limits.
Single axis or triaxial
A single-axis accelerometer is efficient when the critical direction is known, such as radial vibration at a bearing housing. It is easier to fit and can reduce mass and channel count. A triaxial unit captures three orthogonal directions at one location, which helps when vibration direction is uncertain, modal behavior is being studied or repeatable multi-axis placement is valuable.
The BBVM-3XS1000 triaxial IEPE accelerometer illustrates the multi-axis option. Triaxial selection adds channel synchronization, axis orientation, connector and cable breakout, transverse sensitivity and total mounted mass to the checklist. Three axes do not compensate for poor mounting or an insufficient sample rate.
Top exit, side exit and available clearance
A top-exit cable is straightforward when there is room above the sensor and the cable can be supported without pulling on the body. A side-exit form can fit below guards or in low-clearance locations and may simplify routing along the machine surface. The BBVM-RS100 side-exit IEPE accelerometer is relevant to that constraint.
Cable exit is not cosmetic. Check connector tool access, bend radius, strain relief, service loops, oil exposure, moving parts and the direction in which maintenance personnel may apply force. Route cable to reduce triboelectric or electromagnetic interference and prevent cable motion from loading a lightweight test object.
Frequency range is a system property
The useful lower limit is influenced by sensor discharge time constant and signal conditioning. The upper limit is affected strongly by mounting stiffness, sensor resonance, base geometry, cable and the required amplitude tolerance. A broad catalog frequency range is not automatically the flat, phase-accurate band required by an analysis.
| Measurement goal | Selection emphasis | Common risk | Validation evidence |
|---|---|---|---|
| Machine condition monitoring | Stable mounting, repeatable band, environment | Comparing data from changed mounting | Baseline spectrum and route record |
| Low-level vibration | Higher sensitivity and low noise | Electrical noise or cable motion | Noise floor with installed cable |
| High-frequency fault energy | Rigid mount, small sensor, suitable bandwidth | Mounting resonance mistaken for machine response | Mounted response check |
| Shock or high amplitude | Headroom, mechanical robustness, sampling | Sensor or input clipping | Time waveform and overload review |
Mounting method can dominate high-frequency results
A clean, flat, rigid stud mount generally provides the stiffest interface. Adhesive mounting can be practical on small structures or where drilling is prohibited, but the adhesive and adapter introduce compliance. Magnetic mounts are convenient for route-based monitoring on ferromagnetic surfaces, yet surface finish and magnet geometry can reduce the upper usable band. Hand-held probes are appropriate only for limited comparative work where repeatable pressure and location are controlled.
Document surface preparation, mounting torque or adhesive, adapter, orientation and cable support. When trending a machine, changing the mount can create a larger spectral change than the machine itself. PCB’s official accelerometer selection technical note provides application-based guidance across vibration, shock, frequency and environmental conditions.
Acceleration, velocity and integrated temperature
Acceleration highlights different parts of a vibration spectrum than velocity. Digital integration can derive velocity from acceleration over a controlled band, but low-frequency noise, filter choice and sensor behavior affect the result. A dedicated velocity sensor or transmitter may be preferable where the monitoring system expects a velocity output directly.
An integrated vibration-and-temperature sensor can reduce installation points and add process context, but it does not mean the temperature channel measures the hottest internal component. Define where temperature is sensed, response time, output/interface, channel compatibility and whether both measurements meet the maintenance decision.
A practical channel budget and acceptance check
- Define amplitude range, crest factor and analysis band for each axis.
- Choose sensitivity so expected peaks retain headroom and weak signals exceed the installed noise floor.
- Confirm sensor mass and mounting do not alter the test object significantly.
- Select axis count and cable exit from the geometry, not convenience alone.
- Check constant-current supply, bias, compliance, connector, cable and input range.
- Set sampling and anti-alias filters above the useful analysis band.
- Install the sensor using a documented surface and mounting procedure.
- Record a baseline waveform and spectrum, then check clipping, bias and noise.
For an engineering review, send machine type, target faults, frequency band, expected acceleration, axes, mounting surface, available clearance, temperature, cable length, connector, IEPE supply, acquisition model and quantity through the Deep Minds Ultrasonic contact page.
FAQ
Does higher sensitivity always improve vibration measurement?
No. It helps weak signals but can reduce acceleration headroom. Noise and overload must be evaluated together.
Can an IEPE accelerometer measure static tilt?
No. Piezoelectric IEPE sensors are AC-coupled dynamic sensors and do not preserve a true DC acceleration signal.
When is a triaxial sensor worth the added channels?
When direction is uncertain, simultaneous orthogonal response matters or repeatable multi-axis placement saves test time.
Why did the high-frequency spectrum change after remounting?
Mount stiffness, surface, torque, adapter and cable support can change the mounted response. Compare only data taken with a controlled installation.